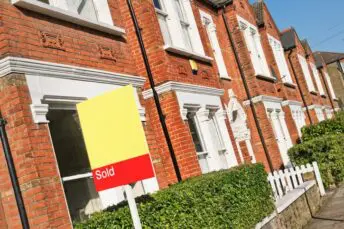
House Price Watch Oct 2022
House prices fell in October and the annual rate of growth slowed sharply. The housing market received a significant shock from the mini-budget and the resulting acceleration of higher mortgage rates. While rates look to have peaked for now, mortgage approvals have continued to fall as some would-be home buyers have inevitably paused their plans. As we move into 2023, a slower period for house prices is expected. Though the outlook is extremely uncertain, there is expected to be an adjustment in prices rather than a sharp fall. A solid jobs market and the continued shortage of homes for sale should help to support house prices.
What’s happening nationally
House prices are down on average -0.4% in the past month and annual house price growth has slowed to +8.3%.
All of the major indices tracking agreed sale prices report stable or falling house prices over the past month. Rightmove reporting asking prices still saw a rise in the monthly prices in October. All of the indices are reporting a slowing of annual house price growth.
Indices based on:
Land Registry – registered property transactions in September.
Nationwide & Halifax – mortgage valuations in October.
Rightmove – asking prices posted on Rightmove in October.
*Rightmove is not included in the index average as the basis for its index is different (asking price vs agreed sale price)
| Index reports: | Monthly change | Annual change |
|---|---|---|
| Land registry | 0.0% | +9.5% |
| Nationwide | -0.9% | +7.2% |
| Halifax | -0.4% | +8.3% |
| Rightmove | +0.9% | +7.8% |
| Average change | -0.4% | +8.3% |
House prices in your area
Most regions of the UK are experiencing a slowing of house price growth, although the annual rate of house price growth remains in double digits in Wales (+12.9%), South West (11.9%), East Midlands (11.3%), East of England (10.4%), South East (10.3%) and the West Midlands region (+10.1%).
Average house prices are highest in London (£544K) and lowest in the North East (£164K).
House price growth varies by property type. Detached homes have seen the biggest rise (+11.4%) and flats/ maisonettes the smallest (+4.8%) according to Land Registry data.
| UK Region | Average price £ | Monthly change | Annual change |
|---|---|---|---|
| England | |||
| Nothern Ireland | |||
| Scotland | |||
| Wales | |||
| North West | |||
| Yorkshire and The Humber | |||
| North East | |||
| West Midlands | |||
| East Midlands | |||
| South West | |||
| East of England | |||
| South East | |||
| London |
| UK City | Average price | Annual change |
|---|---|---|
Market Monitor
Transactions remained steady in September and are slightly higher than usual for this time of year.
There were 104K transactions in September, no change on August 2022 and down 37% on September last year. September 2021 transactions were unusually high because of the end of the final stamp duty holiday.
Demand continues to soften but new seller instructions also fall. Stock of homes for sale is unchanged.
Time to sell is taking longer (40 days) and is now slower than the 12 month average of 36 days — though this is still quicker than long term averages.
How busy is the market?
- Not busy
- Normal
- Very busy
- Transactions steady month on month and slightly higher than is typical this time of year.
- Total transactions in September 104K
- no change from last month
- -37% from September last year (unusually high transactions with end of stamp duty holiday)
Homes for sale vs homebuyers
- Good availability of homes
- Normal
- Shortage of homes
- Buyer enquiries continue to soften (-55% RICS); sixth monthly drop
- Seller enquiries down (-17% RICS)
- Average stock per agent 49; unchanged (incl under offer/ Sold STC Rightmove)
Average speed of sale
- Fast
- Normal
- Slow
- 40 days to find a buyer (12 month average 36 days Rightmove)
What the experts say
Rightmove
![]()
“The proportion of unsold properties seeing a price reduction has increased only slightly from the pre-pandemic 7.5% in October 2019 to 8% this October. However, it has doubled from the figure of 4% in the frenzied market of October 2021. Buyer demand is still performing better than it was during the more normal market of 2019, but it is clear that we have returned to a much more price-sensitive housing market after two years of a buying frenzy. The drop in buyer demand versus the strong market of last year is highest in the typical first-time buyer sector, with demand down by 26% on this time last year, though still up by 7% on this time in 2019. In the second stepper sector demand is down by 17%, and at the top of the ladder there has been a drop of 15%. Overall, total demand is still 4% higher than in 2019, but 20% lower than in October last year as the ongoing financial uncertainty weighs on the market. It’s important to note that there isn’t a glut of unsold properties, and the average number of enquirers for the low number of available properties for sale is still over a third higher than it was back in October 2019, which is helping to prevent any price falls by more than is usual at this time of year.”
Nationwide
![]()
“The market has undoubtedly been impacted by the turmoil following the mini-Budget, which led to a sharp rise in market interest rates. Higher borrowing costs have added to stretched housing affordability at a time when household finances are already under pressure from high inflation. The increase in mortgage rates meant that a prospective first-time buyer earning the average wage and looking to buy a typical FTB home with a 20% deposit would see their monthly mortgage payment rise from c.34% of take-home pay to c.45%, based on an average mortgage rate of 5.5%. The market looks set to slow in the coming quarters. The outlook is extremely uncertain, and much will depend on how the broader economy performs, but a relatively soft landing is still possible. Longer term borrowing costs have fallen back in recent weeks and may moderate further if investor sentiment continues to recover. Moreover, household balance sheets appear in relatively good shape with significant protection from higher borrowing costs, at least for a period, with over 85% of mortgage balances on fixed interest rates. Stretched housing affordability is also a reflection of underlying supply constraints, which should provide some support for prices.”
Halifax
![]()
“Though the recent period of rapid house price inflation may now be at an end, it’s important to keep this is context, with average property prices rising more than £22,000 in the past 12 months, and by almost £60,000 (+25.7%) over the last three years. The housing market received a significant shock as a result of the mini-budget and a sudden acceleration in mortgage rate increases. While it is likely that those rates have peaked for now, recent events encouraged existing mortgage holders to look at their options, and some would-be homebuyers to take a pause. Consumer caution has grown with mortgage approvals and demand for borrowing declining. With tax rises and spending cuts expected in the Autumn Statement, economic headwinds point to a much slower period for house prices. While structural market factors which support higher house prices – like the shortage of properties for sale – are likely to remain, how significantly prices might adjust will also be determined by the performance of the labour market.”
Zoopla (Hometrack)
![]()
“A spike in 2 and 5 year fixed mortgage rates hits demand, down a third since mini budget. Sales are still being agreed at a slower rate, from cash buyers and those with cheap loans – with a pipeline of nearly 293,000 sales in progress. The outlook for 2023 depends largely on the trajectory for mortgage rates. Sustained 6% mortgage rates would lead to double-digit price falls eroding ‘paper’ gains over the pandemic but few negative equity cases. The more likely outcome is a fall in mortgage rates towards 4% and a modest decline in house prices of up to 5% over 2023 with 1m sales. A robust labour market and scarcity of supply will support pricing but markets in southern England are expected to feel the greatest impact.”
RICS
![]()
“The October 2022 RICS UK Residential Survey results point to a further deterioration in market conditions over the month, with the fall in buyer demand and agreed sales gathering pace. On the back of this, house price growth has now ground to a halt at the national level. Respondents across all parts of the UK are now (on balance) of the opinion that prices will see some degree of decline over the year ahead.”